
Your Data Working for you.
From Spreadsheet Chaos to Business Clarity
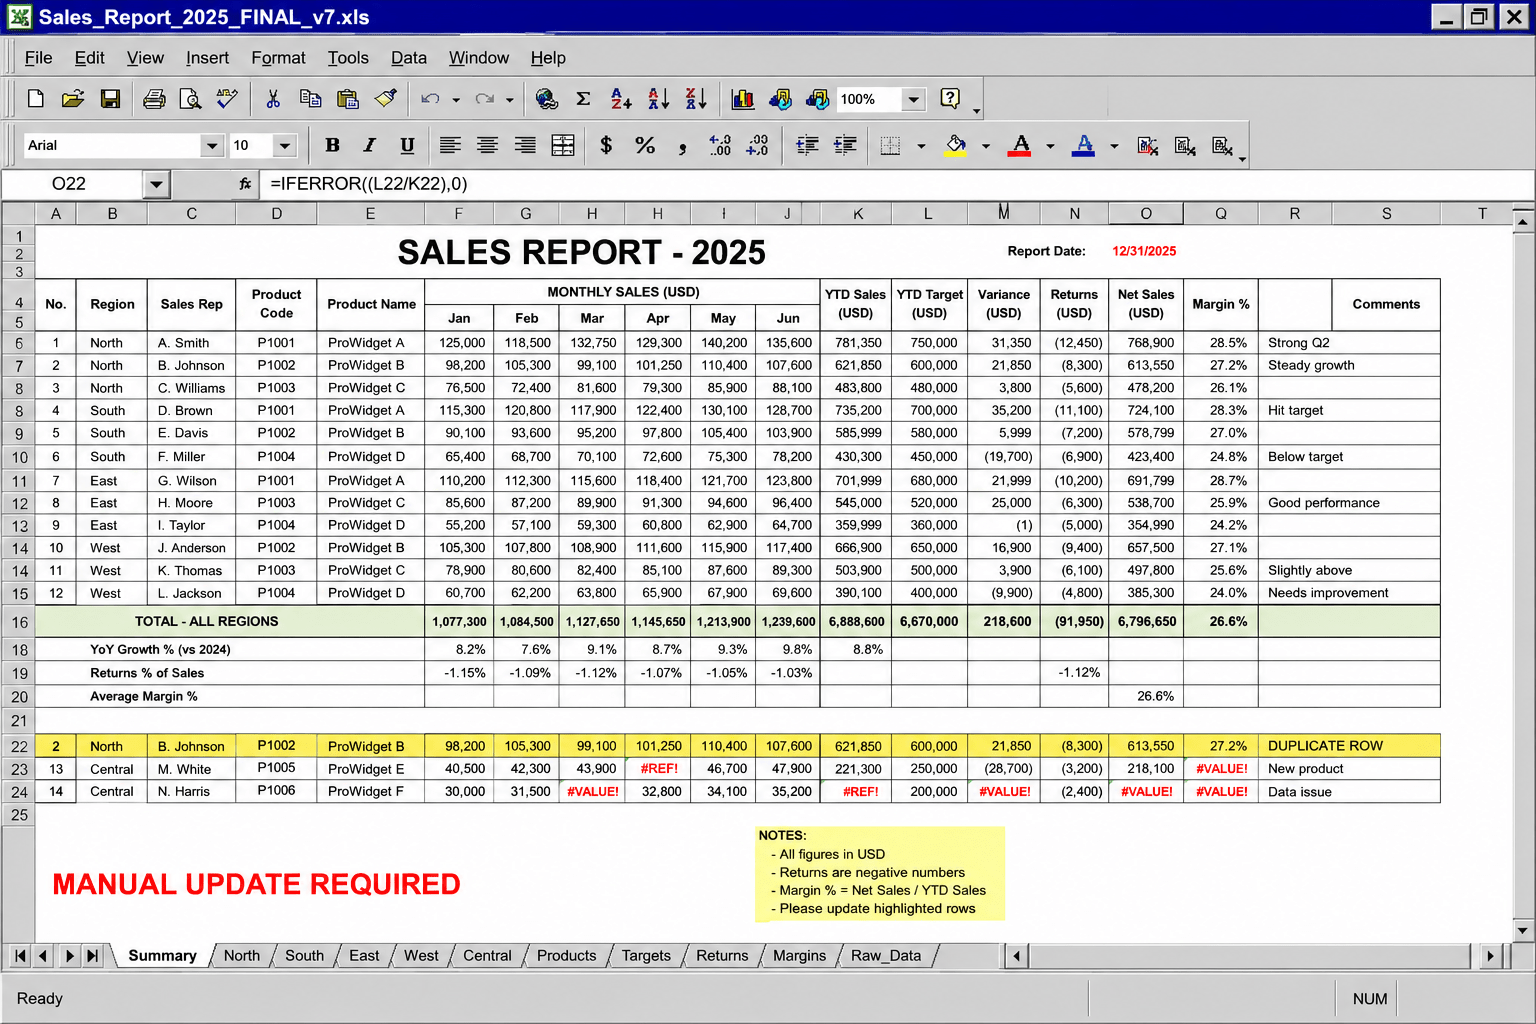
Spreadsheet Automation
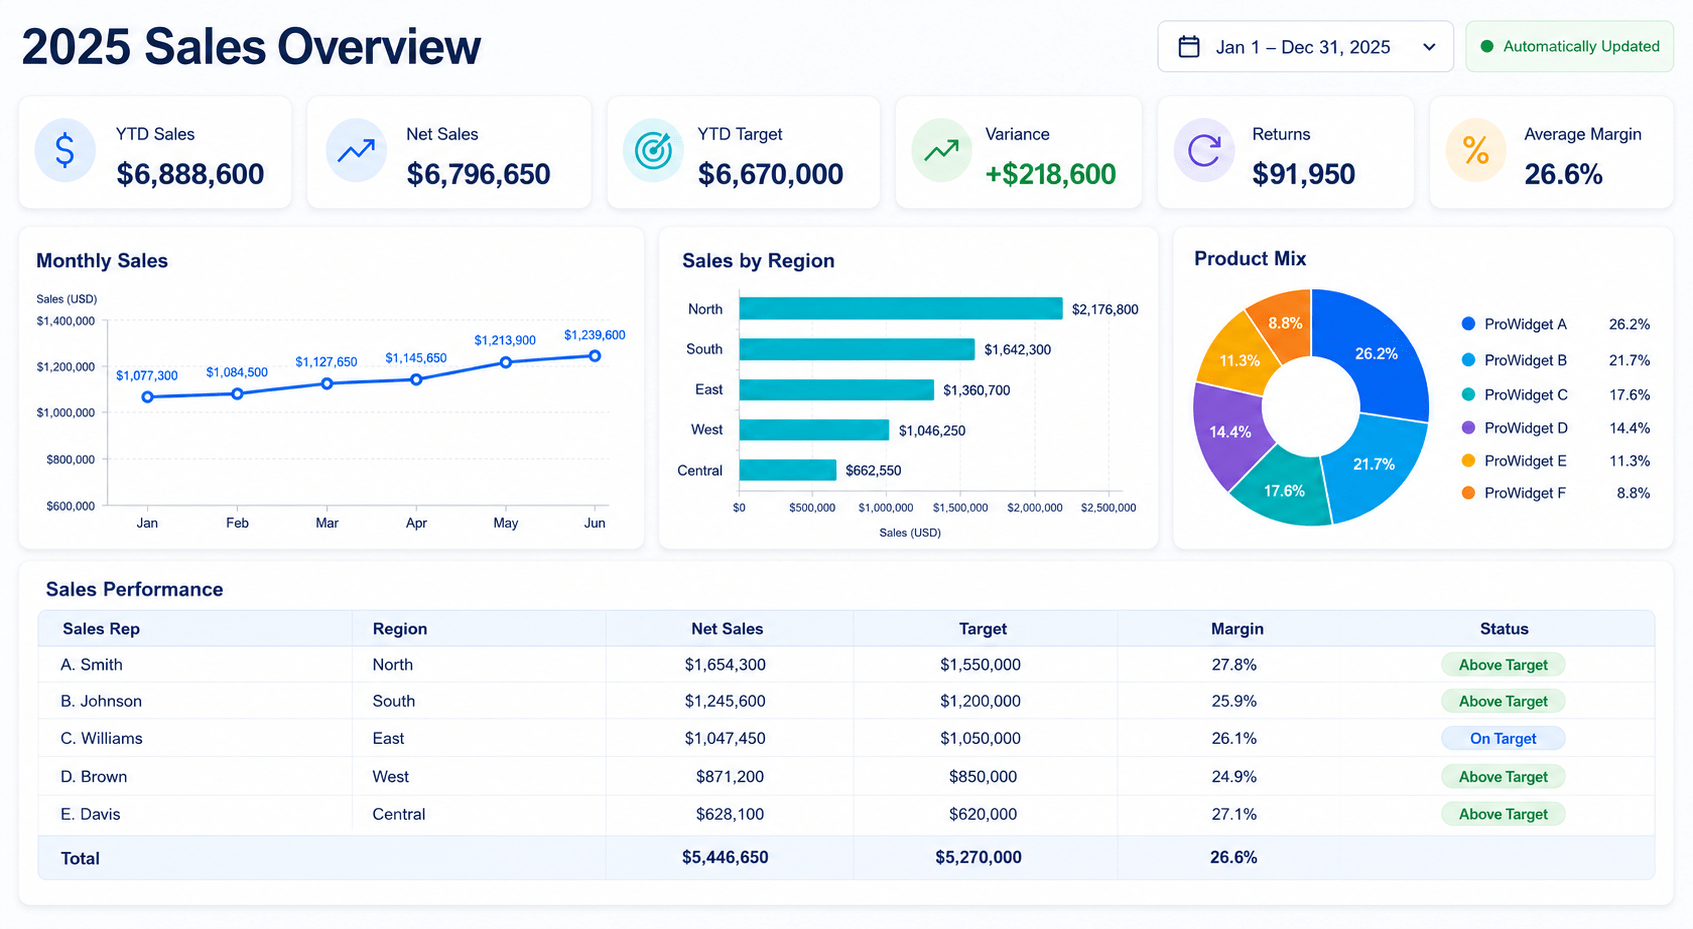
Dashboards & Charts
Data Analysis
Before
After
Solutions Built Around Your Business
Sales Reporting
Turn your sales data into clear, actionable insights. We create automated reports and dashboards that help you monitor revenue, track performance, identify trends, and make informed business decisions—without spending hours manually updating spreadsheets.
Inventory Tracking
Gain a clear view of your inventory without manually searching through multiple spreadsheets. We create automated tracking systems that help you monitor stock levels, identify shortages, prevent overstocking, and make more informed purchasing decisions.
Operations Dashboard
See the bigger picture of your daily operations in one centralized view. We create customized dashboards that help you monitor performance, identify delays, manage workloads, and keep every part of your business aligned. This gives you the clarity needed to make faster and more informed decisions.
Monthly Reporting
Replace repetitive monthly reporting with a faster, more reliable process. We create automated reports that organize your data, update key metrics, and deliver clear insights in an easy-to-understand format. This helps your team make quicker, more informed decisions without spending extra time compiling information.
Save Time Let us organize your Data.
Know Your Numbers. Grow With Confidence
Your sales data tells a story. Are you getting the full picture?
Many businesses rely on disconnected spreadsheets, manual reports, and outdated information to track performance. This makes it difficult to identify opportunities, measure growth, and make timely decisions.
VRTL KEY transforms your raw sales data into clear, interactive dashboards and automated reports that give you a better understanding of your business performance—all in one place.
What We Can Do for Your Business?
Revenue & Sales Performance Tracking
Monitor total revenue, sales growth, and performance across products, services, teams, or locations.
Interactive Sales Dashboards
Visualize your most important sales metrics through customized dashboards designed around your business goals.
Automated Reporting
Reduce repetitive manual work with reports that refresh from your available data sources, helping you spend less time preparing information and more time using it.
Sales Trends & Forecasting
Identify seasonal patterns, compare historical performance, and use available sales data to support future planning.
Product & Customer Insights
Discover your best-performing products, understand purchasing trends, and identify valuable customer segments.
Custom KPI Monitoring
Track the metrics that matter most to your business, from revenue targets and average order value to sales conversion rates.
From Spreadsheets to Business Intelligence
Stop spending hours gathering information from multiple sources.
We help you organize, automate, and visualize your sales data so you can:
Make faster, more informed business decisions.
Identify growth opportunities and underperforming areas.
Reduce manual reporting errors.
Monitor performance against business goals.
Access consistent, easy-to-understand reports.
Your Data. Your Dashboard. Your Advantage.
Every business operates differently. That’s why we build reporting solutions around your existing workflows, available data, and specific objectives.
Whether you’re managing a growing business or looking to improve your current reporting process, VRTL KEY helps turn complex information into practical insights.
Ready to see what your sales data can do?
Let’s explore how a customized reporting solution can help your business operate smarter.